Television Research
 Blockbuster or cult favorite? In the world of television production, it’s all in the numbers, and the Bates Library has them for you.
Television research is like a CSI episode. The culprit can hide in communication, sociology, psychology, and just about any other type of database. Give yourself time and search systematically; you’ll find everything you need to make your case.
The Nielsen Ratings provide rich data on the numbers and types of viewers that watch television — over-the-air, cable, and most recently via DVR delay. While even highly restricted access to the raw data from The Nielsen Company can cost many thousands of dollars per year, Bates has ready access to those Nielsen data that are reported in entertainment industry publications.
At Bates, the most complete source for Nielsen Ratings is a publication called “Daily Variety.” While there is some access to this publication in news databases like Lexis/Nexis and Campus Research, those resources will lack any graphics or charts that are used to make the ratings understandable. Instead you should use MasterFILE Premier. (If you don’t want to come back to this blog post all the time, you can find it in the Bates library catalog or in the alphabetical list of databases.)
MasterFILE Premier can be searched like other EBSCO databases. Just type a few words in one of the three search boxes. **Remember: if you use quotes, it will keep your words together in a phrase:
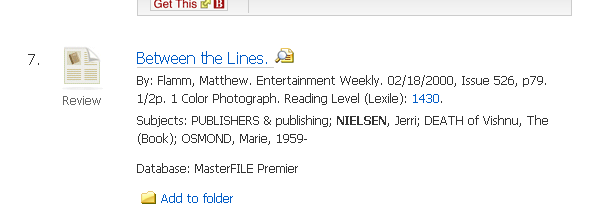
 This search yields 1400+ articles, but — as you might imagine — quite a few have titles like “The Eye Doctor Who Makes House Calls.” Not quite what we need. Add the term ‘Nielsen’ on the second line. Now all eight articles the database finds are about Jerri Nielsen, the doctor who had to be rescued from the South Pole:
This doesn’t mean that no one watches our “Doctor Who,” it just means that we need to use different terminology. Let’s try the term ‘audience OR viewers’ (no quotes, but do capitalize OR).
This returns 40 articles, and they include information like this: “He states the program gained more viewers in 2010 when Matt Smith took over the lead role, as it attracted 1.2 million viewers in its season premiere.” This is information that is derived from a Nielsen report. It’s just that it’s not phrased in their standard format, and they are not cited. Don’t ignore titles that would seem to be off topic. The article “RNC viewers went AWOL” from USA Today on September 6, 2012 has the tidbit of information “Record setting. BBC America’s Doctor Who opener (1.6 million Saturday) set a channel record…” This doesn’t give us exact Nielsen Ratings, but we have a number that we can compare.
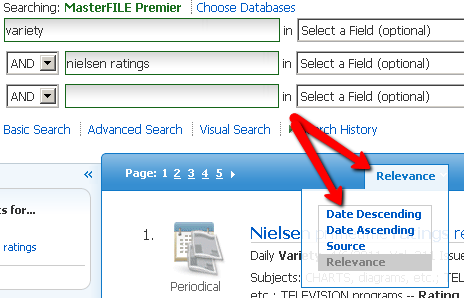
If you do want to see the Nielsen Ratings, so that you can gauge how your show compares to the ones that did make the charts, it’s simple. Change the first search box to ‘variety’ and the second search box to ‘nielsen ratings’ (no quotes in either one). For this search, the best organization of the articles returned is by Date Descending. That way you can zero in on reports for the weeks that your show aired:
For instance, the latest season of Doctor Who premiered in the US on the Saturday of Labor Day weekend. So If I look at the charts from that weekend, I can see what other channels were airing at 9PM Eastern on Saturday.
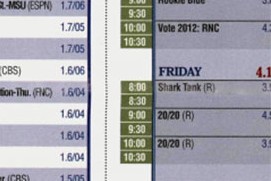
Finally, you see some numbers. the seventh season of Doctor Who premier against the Auburn/Michigan football game — the highest ranked program for the entire week, with 7.92 million viewers, and a Nielsen Rating of 3.0/11. But of potentially more concern to the Doctor Who researcher are the crime and mystery programs that are also airing in that 9-10 PM slot. Even though they are repeats — indicated by the (R) — there may be more potential for a crossover audience with these programs:
Finally, when all of your resources are used up in MasterFILE Premier, remember to click “Choose Databases” and “Select all.” Now you can do those searches all over again. You WILL find more!


