To view any of the dashboards, select the heading or thumbnail to right.
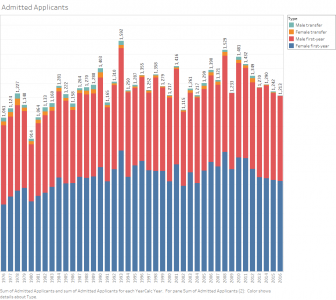
The Admission dashboard includes: - Number of applicants
- Number of admitted students
- Total and first-year admit rate
- Yield rate
|  |
The Demographics dashboard includes: - Enrollment by race
- Enrollment by gender
- Enrollment of Pell Grant recipients
- Enrollment by college generation (first generation to college)
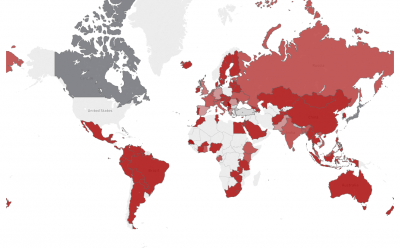
- Enrollment by international students
- Enrollment by country of residence
|
 |
The Enrollment dashboard includes:
- Total fall enrollment
- Enrollment by gender
- Enrollment by race
- Enrollment by college generation (first generation to college)
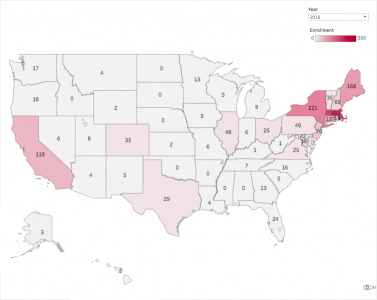
- Enrollment by state and country of residence
|
 |
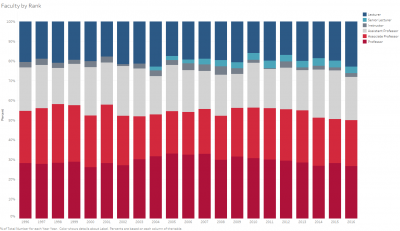
The Faculty dashboard includes: - Faculty by rank
- Tenure track faculty
- Faculty by divison
- Faculty by gender
- Faculty of color
|  |
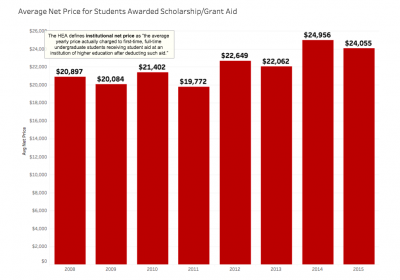
The Financial Aid dashboard includes:
- All student aid
- First-year cohort aid
- Average net price
|  |
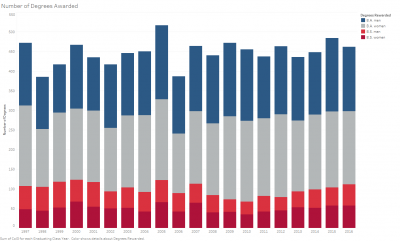
The Graduation & Retention dashboard includes:
- 4 and 6 year graduation rates
- Retention rate
- Number of degrees awarded (B.A. and B.S.)
|
 |